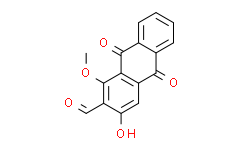


| 中文名称 |
Damnacanthal
|
|---|---|
| 中文别名 |
丹宁卡;[5-氟-2-甲基-3-(喹啉-2-基甲基)吲哚-1-基]乙酸;3-羟基-1-甲氧基-2-蒽醌甲醛;丹拿堪索
|
| 英文名称 |
Damnacanthal
|
| 英文别名 |
Damnacanthal;2-Anthracenecarboxaldehyde,9,10-dihydro-3-hydroxy-1-methoxy-9,10-dioxo-;DAMNACANTHAL(RG);3-hydroxy-1-methoxy-9,10-dioxoanthracene-2-carbaldehyde;3-Hydroxy-1-methoxy-2-anthraquinonecarboxaldehyde;[
""
]
|
| Cas No. |
477-84-9
|
| 分子式 |
C16H10O5
|
| 分子量 |
282.25
|
| 包装储存 |
4°C, protect from light *In solvent : -80°C, 6 months; -20°C, 1 month (protect from light) |
| 详情描述 |
p56lck酪氨酸激酶抑制剂,Damnacanthal 是从 Morinda citrifolia 的根中分离出来的蒽醌。Damnacanthal 是一种强效选择性的 p56lck 酪氨酸激酶活性的抑制剂。天然的 Damnacanthal 抑制 p56lck 的自磷酸化和外源底物的磷酸化,IC50 分别为 46 nM 和 220 nM。
|
| 生物活性 |
Damnacanthal is an anthraquinone isolated from the root of Morinda citrifolia. Damnacanthal is a highly potent, selective inhibitor of p56 tyrosine kinase activity. Natural Damnacanthal inhibits p56 autophosphorylation and phosphorylation of exogenous substrates with IC50s of 46 nM and 220 nM, respectively. Damnacanthal is a potent inducer of apoptosis with anticancer activity. Damnacanthal also has antinociceptive, anti-inflammatory effects in mice and anti-fungal activity against Candida albicans. |
||||||||||||||||||||||||||||||||
|---|---|---|---|---|---|---|---|---|---|---|---|---|---|---|---|---|---|---|---|---|---|---|---|---|---|---|---|---|---|---|---|---|---|
| 性状 |
Solid |
||||||||||||||||||||||||||||||||
| IC50 & Target[1][2] |
IC50: 46 nM (p56 autophosphorylation) and 220 nM (phosphorylation of exogenous substrates by p56 ); |
||||||||||||||||||||||||||||||||
| 体外研究(In Vitro) |
Damnacanthal has > 100-fold selectivity for p56 over the serine/threonine kinases, protein kinase A and protein kinase C, and > 40-fold selectivity for p56 over four receptor tyrosine kinases. Damnacanthal also demonstrates modest (7-20-fold), but highly statistically significant, selectivity for p56 over the homologous enzymes p60 and p59. Medlife has not independently confirmed the accuracy of these methods. They are for reference only. Cell Proliferation Assay
Cell Cycle Analysis
Apoptosis Analysis
Western Blot Analysis
|
||||||||||||||||||||||||||||||||
| 体内研究(In Vivo) |
Damnacanthal (10-100 mg/kg; oral administration; for 10-300 minutes; male ddY mice) treatment exhibits a significant antinociceptive effect in a dose-dependent manner in the formalin test. Administration of damnacanthal (100 mg/kg) shows significant inhibition of histamine-induced paw edema. Medlife has not independently confirmed the accuracy of these methods. They are for reference only.
|
||||||||||||||||||||||||||||||||
| 运输条件 |
Room temperature or refrigerated transportation. |
||||||||||||||||||||||||||||||||
| 储存方式 |
4°C, protect from light *In solvent : -80°C, 6 months; -20°C, 1 month (protect from light) |
||||||||||||||||||||||||||||||||
| 结构分类 | |||||||||||||||||||||||||||||||||
| 来源 | |||||||||||||||||||||||||||||||||
| 参考文献 |
|
| 溶解度数据 |
体外研究:
DMSO : 5 mg/mL (17.71 mM; ultrasonic and warming and heat to 60°C) 配制储备溶液
*
产品不同,其溶解度不同。建议根据产品选择合适的溶剂配制储备溶液;配成溶液后,建议分装保存,避免反复冻融造成的产品失效。 体内研究:
建议根据您的实验动物和给药方式选择适当的溶解方案。以下溶解方案都建议先按照 体外研究 方式配制澄清的储备液,再依次添加助溶剂:
——为保证实验结果的可靠性,澄清的储备液可以根据储存条件,适当保存;体内实验的工作液,建议您现用现配,当天使用;
以下溶剂前显示的百 *
|
|---|
[1]. Faltynek CR, et al. Damnacanthal is a highly potent, selective inhibitor of p56lck tyrosine kinase activity. Biochemistry. 1995 Sep 26;34(38):12404-10. [Information]
[2]. Nualsanit T, et al. Damnacanthal, a noni component, exhibits antitumorigenic activity in human colorectal cancer cells. J Nutr Biochem. 2012 Aug;23(8):915-23. [Information]
[3]. Aziz MY, et al. Damnacanthal is a potent inducer of apoptosis with anticancer activity by stimulating p53 and p21 genes in MCF-7 breast cancer cells. Oncol Lett. 2014 May;7(5):1479-1484. [Information]
[4]. Okusada K, et al. The antinociceptive and anti-inflammatory action of the CHCl3-soluble phase and its main active component, damnacanthal, isolated from the root of Morinda citrifolia. Biol Pharm Bull. 2011;34(1):103-7. [Information]
1:一般建议:溶解度为Medlife测试数据,可能与文献描述存在差异。这是由于生产工艺和批次不同产生的正常现象。为了使其更好的溶解,请用37℃加热试管并在超声波水浴中震动片刻。不同批次产品溶解度各有差异,仅做参考,具体以实验方案为准。
2:储存条件:粉末-20°C一般情况可以保存3年,溶于溶剂-80°C一般情况可以保存1年。不同产品及不同批次产品可能存在差异,请细致阅读产品信息,并辅助参考相关文献描述。
Copyright © 2025 陌孚医药 All rights reserved 未经授权禁止拷贝本站所有资料,如有违反,将追究法律责任。
 沪ICP备2023012080号 |
  沪公网安备31011402010657号
 扫码关注公众号
